| مشخصات مقاله پاورپوینت انگلیسی | |
| عنوان فارسی مقاله | انتقال حرارت نامشخص |
| عنوان انگلیسی مقاله | Unsteady State Heat Transfer |
| فرمت مقاله | پاورپوینت (PPT یا PPTX) |
| تعداد اسلایدها | 27 اسلاید |
| قابلیت ویرایش | دارد |
| قابلیت پرینت | دارد |
| رشته های مرتبط با این مقاله | مهندسی برق |
| کد محصول | EP850 |
دانلود رایگان پاورپوینت انگلیسی سفارش ترجمه این پاورپوینت
| تصویری از مقاله |
 |
| فهرست مطالب |
|
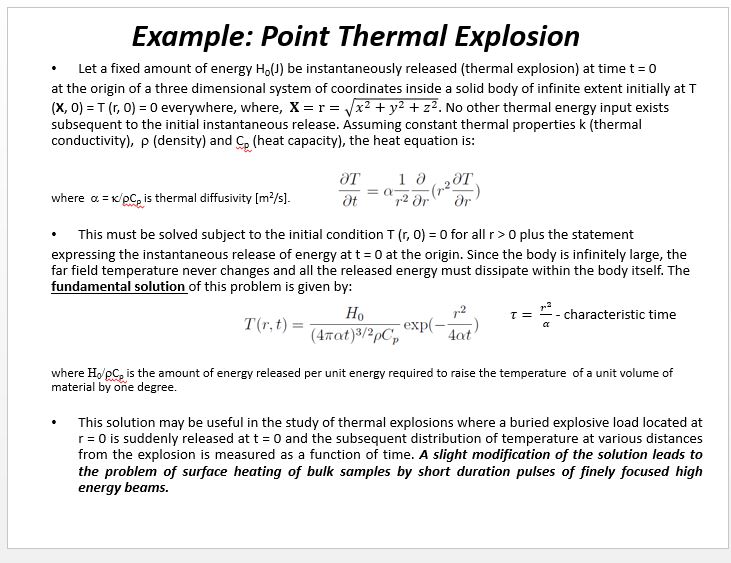
Unsteady State Heat Transfer |
| بخشی از مقاله |
| Graphical Solutions : Heisler Charts The solutions obtained for 1D non homogeneous problems with Neumann boundary conditions in Cartesian coordinate systems using the method of separation of variables have been collected and assembled in the form of transient temperature nomographs by Heisler. The given charts are a very useful baseline against, which to validate one’s own analytical or numerical computations. Indeed, the determination of the constants A1 and l1 usually requires interpolation. For those who prefer reading charts to interpolating, these relations are plotted and the one-term approximation solutions are presented in graphical form, known as the transient temperature charts. The transient temperature charts shown in next slides for a large plane wall, long cylinder, and sphere were presented by M. P. Heisler in 1947 and are called Heisler charts. There are three charts associated with each geometry: the first chart is to determine the temperature T0 at the center of the geometry at a given time t. The second chart is to determine the temperature at other locations at the same time in terms of T0. The third chart is to determine the total amount of heat transfer up to the time t. These plots are valid for t > 0.2. |
دانلود رایگان پاورپوینت انگلیسی سفارش ترجمه این پاورپوینت